
Technical SEO
Lighthouse Audit for Multiple Pages with Codex
Run a Lighthouse audit on every page of your site with Codex: audit each route, read the median scores, and fix slow templates in your own code.
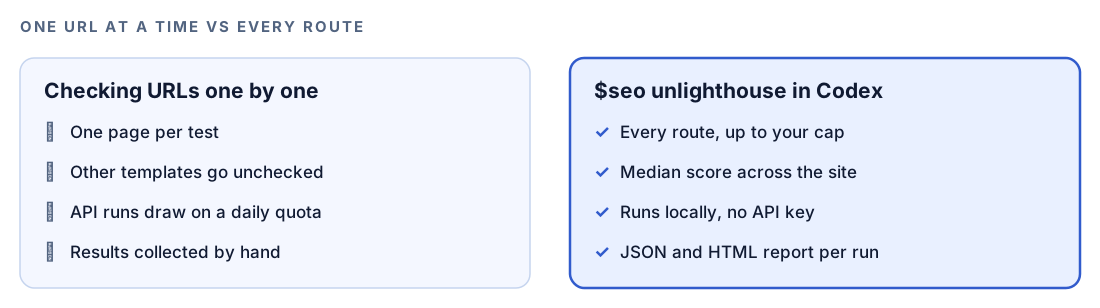
The easiest way to have Lighthouse audit multiple pages of your site in one go is to let Codex run it for you. RankCue's Codex SEO kit includes $seo unlighthouse <url>, which runs Lighthouse against every route it finds, up to a cap you set, and rolls the results into one report, locally and with no API key. This guide covers what lab scores across a whole site can and can't tell you, how the command runs, how to read the medians, and how Codex fixes slow templates in your codebase.
Key takeaways
$seo unlighthouse <url>runs a mobile Lighthouse audit on up to 200 routes by default and reports the median performance score plus accessibility, best practices and SEO scores.--device desktopswitches the form factor,--max-routeschanges the cap, and--output-dirkeeps the JSON and HTML reports, which otherwise go to a temporary folder.- It runs locally through Unlighthouse, needs Node.js 18 or newer, and uses no API key or PageSpeed Insights quota.
- Lighthouse gives lab data. Google's Core Web Vitals assessment uses field data from real Chrome users, so confirm important pages with
$seo google crux.- Slow scores usually cluster by template, which is where one Codex fix can lift many pages at once.
The multi-page Lighthouse command at a glance
| Item | Details |
|---|---|
| Command | $seo unlighthouse <url>, with optional --device desktop, --max-routes <n> and --output-dir <folder> |
| What you give it | Your site's start URL, plus an optional device, route cap and output folder |
| What Codex reads | Lighthouse results for every route Unlighthouse audits, collected in one result file |
| What you get back | The median performance score, accessibility, best practices and SEO scores, a JSON and HTML report, and a per-route breakdown |
| Needs | The optional Unlighthouse extension, Node.js 18 or newer, and internet access to reach the site. No API key |
| Best for | Large sites, checks after a deploy, CI pipelines, and setups where the PageSpeed Insights API isn't practical |
Lighthouse is Google's automated page audit tool. Unlighthouse is a separate tool that runs Lighthouse across many URLs of one site and gathers the results. The kit's optional extension sets it up so Codex can drive it.
Why run Lighthouse on every page?
Most teams test the homepage, see a decent score, and move on. But visitors and search engines land on every kind of page, and each template behaves differently. A blog template might load a heavy video embed, a product template might ship three carousels, and a category page might render a huge list. One URL can't show you any of that.
Lab data and field data
Lighthouse produces lab data: one simulated page load on a set device profile and network speed. It's repeatable, which makes it good for debugging and for comparing before and after a change. Field data comes from real Chrome users, collected in the Chrome UX Report (CrUX) over a rolling 28-day window. Google's Core Web Vitals assessment uses field data at the 75th percentile, so a page passes a metric when at least three out of four visits meet the "good" threshold.
| Aspect | Lab data (Lighthouse) | Field data (CrUX) |
|---|---|---|
| Source | One simulated visit | Real Chrome users |
| Timing | The moment you run it | A rolling 28 days |
| Good for | Debugging and before-and-after checks | Judging real experience |
| Coverage | Any page you can load | Pages with enough traffic |
The kit's performance guidance sets the order: prefer field data when it exists, and fall back to lab data when CrUX has nothing for a page because traffic is too low. That's where a multi-page run earns its keep. Many low-traffic pages never collect enough visits for field data, so lab results are the only performance signal you have for them.
The Core Web Vitals thresholds
| Metric | Good | Needs improvement | Poor |
|---|---|---|---|
| LCP (Largest Contentful Paint) | 2.5 s or less | 2.5 s to 4.0 s | Over 4.0 s |
| INP (Interaction to Next Paint) | 200 ms or less | 200 ms to 500 ms | Over 500 ms |
| CLS (Cumulative Layout Shift) | 0.1 or less | 0.1 to 0.25 | Over 0.25 |
LCP measures loading, INP measures responsiveness, and CLS measures visual stability. INP is now the only responsiveness metric in Core Web Vitals. A page-load test can't measure it directly, because nobody taps or clicks during a Lighthouse run, so Total Blocking Time (TBT) is the lab signal that points to the same main-thread problems. The Core Web Vitals overview on web.dev explains each metric in depth.
Mobile first, then desktop
The command audits the mobile form factor by default. That matches how Google indexes the web, using the mobile version of your pages. Lighthouse's mobile run also simulates a slower device and connection, so it surfaces problems a fast laptop hides. Run --device desktop as a second pass when desktop traffic matters to you.
How $seo unlighthouse runs inside Codex
When you type the command in a Codex task, the skill passes your flags to a wrapper that runs Unlighthouse and reads the results back.
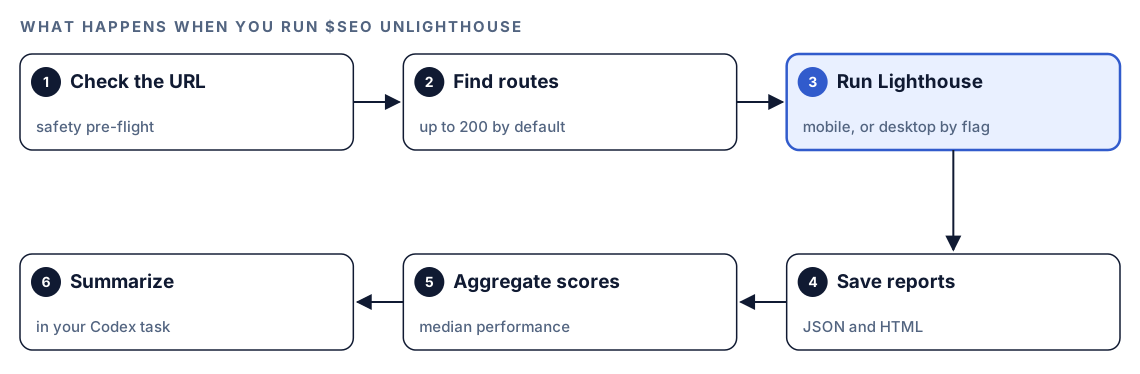
- Check the URL. Before anything runs, a safety pre-flight checks the URL you gave.
- Find routes. Unlighthouse collects the site's URLs, up to 200 by default or the cap you set with
--max-routes. - Run Lighthouse. Each route gets a Lighthouse audit on the mobile profile, unless you pass
--device desktop. The wrapper manages timeouts, so one hung page can't stall the task. - Save reports. Unlighthouse writes a JSON and an HTML report. Without
--output-dir, they go to a temporary folder. - Aggregate scores. The wrapper reads the result file and pulls out the median performance score across all audited routes, plus the accessibility, best practices and SEO scores.
- Summarize. Codex reports the scores in the task. The per-route breakdown stays in
ci-result.jsonin the output folder.
A median is the middle value when you sort all the route scores. Unlike an average, it isn't pulled around by a few extreme pages, so one broken route won't sink the headline number and one perfect route won't prop it up.
What Codex checks when a route is slow
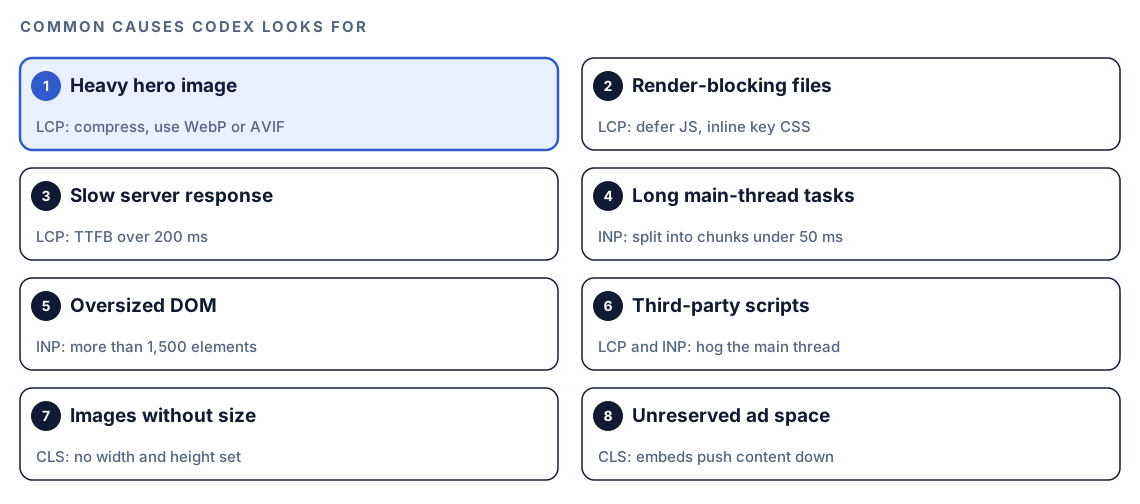
The scores tell you where to look. The kit's performance agent, the specialist the full audit uses for Core Web Vitals, keeps a checklist of the usual causes, and you can ask Codex to apply it to your slowest routes.
Loading (LCP)
The largest element on screen, usually a hero image or headline block, shows up late. Typical causes are an unoptimized hero image (compress it, serve WebP or AVIF, preload it), render-blocking CSS and JavaScript (defer scripts, inline critical CSS), and a slow server, which the agent flags when time to first byte passes 200 ms (add caching or an edge CDN). Third-party scripts and slow web fonts can hold up rendering too.
Responsiveness (INP)
The page reacts slowly to taps and clicks because the main thread is busy. The agent looks for long JavaScript tasks (split them into chunks under 50 ms), heavy event handlers (debounce them or use requestAnimationFrame), a DOM with more than 1,500 elements, third-party scripts that take over the main thread, and synchronous work that blocks input.
Visual stability (CLS)
Content jumps while the page loads. The usual causes are images without width and height, content injected above what's already there, web fonts that swap in and reflow text, ads and embeds without reserved space, and late elements that push others down.
The agent reports in a fixed shape: a performance score, a pass or fail for each Core Web Vital, the specific bottlenecks, and recommendations ordered by expected impact. Ask for that shape when you follow up on a slow route, and every investigation reads the same way.
Run it in Codex, step by step
- Install the Codex SEO kit from the install section, restart Codex, and open a new task in your site's project. Our guide to installing SEO skills in Codex has the details.
- Install the Unlighthouse extension that ships with the kit. It needs no API key, only Node.js 18 or newer on your PATH. Run
node --versionif you're not sure which version you have. - Check your permission mode. The audit loads your live pages, so depending on your mode, Codex may ask before it uses the internet. Approve it for the site you're testing.
- Run the default mobile audit:
$seo unlighthouse https://example.com- Add options when you need them:
$seo unlighthouse https://example.com --device desktop
$seo unlighthouse https://example.com --max-routes 50 --output-dir ./reports- Or ask in plain language, and Codex picks the skill because the request matches its description:
Run Lighthouse on every page of https://staging.example.com, up to 50 routes, save the reports in ./reports, and tell me which routes have the lowest performance scores.A staging or preview URL is a good target before a release. Run it against production after the deploy to confirm nothing slipped.
Reading the report
Codex summarizes the aggregate scores in the task. The wording varies, but it looks something like this:
## Unlighthouse summary: example.com (mobile)
Routes audited: XX
Reports: ./reports (JSON and HTML)

| Category | Score |
|---|---|
| Performance (median) | XX |
| Accessibility | XX |
| Best practices | XX |
| SEO | XX |

Per-route breakdown: ./reports/ci-result.json
Work through it in this order:
- The performance median. This is your typical page. If it's low, look at shared code first: the layout, global scripts, fonts or the server.
- Low routes, grouped by template. Ask Codex to sort
ci-result.jsonby performance and group routes by URL pattern. If every/blog/...route scores low and the/docs/...routes don't, start with the blog template. - SEO and accessibility scores. Lighthouse's SEO category covers basics such as a missing title or meta description, links that can't be crawled, and pages blocked from indexing. Failures there are usually quick template fixes.
- Field data for pages that matter. For pages with real traffic, run
$seo google crux <url>to see what users experience before you spend days on a lab number.
Scores drift a few points between runs because of network and CPU noise. Compare runs that use the same device and route cap, and look for consistent drops rather than single-point changes.
Apply the fixes with Codex
This is where a report becomes a change you can ship. Codex can open the template behind the slowest routes, find the cause, and fix it once for every page that uses it.
A common case is a blog template whose hero image is a large PNG with no dimensions, lazy-loaded by default. Before:
<img src="/images/hero.png" class="post-hero" loading="lazy">After:
<link rel="preload" as="image" href="/images/hero.webp" fetchpriority="high">
<img src="/images/hero.webp" class="post-hero" width="1200" height="630" alt="Diagram of the release process" fetchpriority="high">
The image is now lighter, found earlier, no longer lazy-loaded (lazy loading the LCP element delays it), and sized so it can't shift the layout. Non-critical third-party widgets get deferred the same way:
<script src="/js/chat-widget.js" defer></script>Then ask Codex to work through the template:
Read ./reports/ci-result.json from the Unlighthouse run. Group routes by URL pattern and find the template with the lowest median performance score. Check that template and its components for the common LCP, INP and CLS causes: hero image format and size, a lazy-loaded LCP image, missing width and height, render-blocking scripts and third-party tags. Make the fixes, show me the diff, and run the build. Then run $seo unlighthouse again with the same --max-routes and --output-dir so we can compare.Read the diff before you accept it, and check that deferred scripts still work, because some widgets break when their load order changes. Keep the before and after reports side by side. A higher median on the same routes is your proof.
Make it repeatable
Performance slips quietly, one new script or oversized image at a time. The skill names a site-wide check after a deploy, and CI use, among its main jobs. codex exec runs Codex without the interactive UI, so the audit can run as a step after every staging deploy:
codex exec --sandbox workspace-write \
  '$seo unlighthouse https://staging.example.com --max-routes 50 --output-dir ./reports/unlighthouse. Summarize the median performance, accessibility, best practices and SEO scores, compare them with the newest summary in reports/lighthouse/, and list any route whose performance score dropped.' \
  -o "reports/lighthouse/$(date +%F).md"
The single quotes stop the shell from expanding $seo. --sandbox workspace-write lets Codex save the reports, and -o writes the final summary to a dated file you can commit or attach to the build. The runner needs Node.js 18 or newer, and you should make sure your sandbox and permission setup allows the network access the task needs; the Codex sandboxing docs cover the options. Keep the cap and device fixed so the numbers compare. Our guide to automating SEO checks with codex exec has more patterns.
Without the skill: a plain Codex prompt
Use the Lighthouse CLI through npx to test these URLs on the mobile profile: https://example.com/, https://example.com/blog/sample-post and https://example.com/pricing. Save each JSON report in reports/lighthouse/. Then build a table with the performance, accessibility, best practices and SEO scores plus LCP, CLS and Total Blocking Time for each URL, and tell me which template the slowest pages share.That works for a handful of URLs you pick by hand. What the skill adds is route discovery across the whole site, a cap you control, a median that sums up the site in one number, a URL safety check, timeout handling, and the same report shape every time.
Pitfalls to avoid
- Treating a Lighthouse score as your Core Web Vitals result. Google's assessment uses field data.
- Forgetting
--output-dir, so the reports vanish with the temporary folder. - Comparing runs made with different devices or route caps.
- Sending 200 routes at a small production server during peak hours. Use staging or a lower cap.
- Lazy-loading the hero image, which delays the LCP element.
- Ignoring responsiveness because a page-load test can't measure INP. High Total Blocking Time is your warning sign.
- Chasing 100 on every route instead of fixing the templates most visitors see.
Keep going
- Search Console, GA4 and PageSpeed data in Codex adds the field data to check lab scores against.
- Image SEO with Codex goes deeper on the image fixes that move LCP and CLS.
- Technical SEO audit with Codex puts performance next to crawling, indexing and rendering checks.
- See every skill in both kits, including the other optional extensions.
FAQ
Can Lighthouse test multiple pages at once?
Lighthouse itself audits one URL per run. Tools such as Unlighthouse run it across many URLs of a site and combine the results, which is what $seo unlighthouse does inside Codex.
How do I run Lighthouse on every page of my site with Codex?
Install RankCue's Codex SEO kit and its Unlighthouse extension, then run $seo unlighthouse https://example.com in a Codex task. It audits up to 200 routes by default, and --max-routes changes the cap.
Is a Lighthouse score the same as Core Web Vitals?
No. Lighthouse is a lab test of one simulated visit, while Google assesses Core Web Vitals from real Chrome users over 28 days at the 75th percentile. Use Lighthouse to find and fix problems, and field data to confirm the result.
Why do Lighthouse scores change between runs?
Each run depends on network conditions, CPU load and server response time at that moment. Compare runs made with the same settings, and trust patterns across many routes more than any single score.
Does $seo unlighthouse need a PageSpeed Insights API key?
No. It runs Lighthouse locally through Unlighthouse, so there's no API key and no PageSpeed Insights quota involved. It does need Node.js 18 or newer.